July 8, 2020
The Graphing Tool: Math Made Easy
Please note that this post might include outdated information. For more up to date information about the graphing and formula tool, click here
Constructing graphs is a relatively straightforward task, requiring students to learn a small set of rules for each type of graph. However, math teachers’ experiences suggest otherwise. For many of my students, whilst teaching high school math, graphing is one section that caused a lot of frustration. From simple straight lines to more complex trig or cubic functions, students find drawing graphs hard and thus don’t like it. Hence, the mentality “graphing is where I draw the line.”

“I’ll do the algebra. I’ll do the trig. I’ll even do the statistics. But graphing is where I draw the line.”
The problem? Drawing graphs takes students a long time.
By the time they have drawn the x and y axes, selected equally-spaced intervals, subbed in values, plotted coordinates, joined the dots… they have completely forgotten the relationship they were plotting! And I haven’t even mentioned finding a ruler and sharpening their pencils (at least another 5 minutes).
There is never enough time for the important questions: how does x relate to y? Where does the graph start and end? Can you see any symmetry? What transformation has occurred? If you even had time to plot 2 graphs, can you see where they intersect?
In spending so much time plotting, students don’t see enough graphs. They aren’t exposed to the variety of shifts, stretches, domain and range changes, flips about the axes, and much more. This is where logical connections are cemented and the beauty of math lies and, most importantly, where the confidence of your students will soar.
Because that’s what math is all about... confidence.
The Solution? More graphs!
Show your students every type of graph there is and answer all those crucial questions with the power of a graphing tool which allows you to plot and insert graphs by simply typing in the equation.
At Lessonspace we have a built-in graphing tool that will generate all the graphs you need and insert them into the whiteboard you are working on. It's just another way we're making teaching online even easier.
Here’s how:
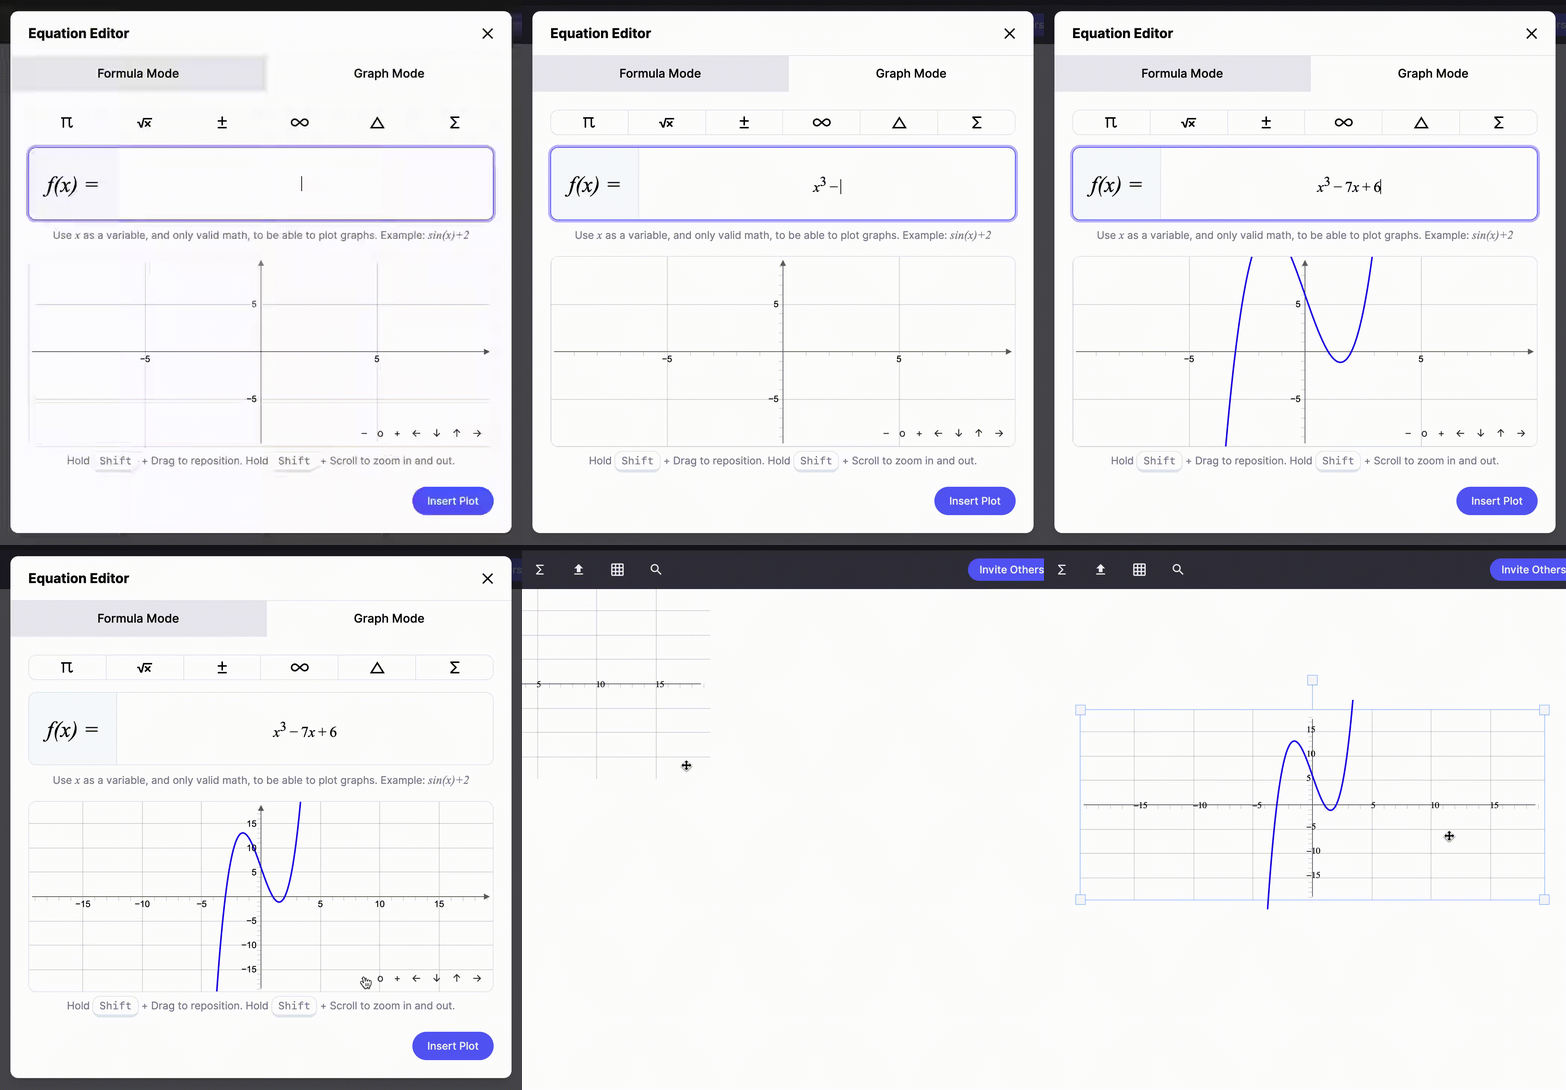
In your Space, on your Whiteboard, click on the Equation Tool and select Graph.

Type in the function you want to plot, adjust your view of the axes, and hit the “Insert Plot” button. The graph will be dropped into your whiteboard (just like an image) and you can move it, resize it and annotate it as you teach.
 We're so excited to roll out another dedicated Mathematics tool, and we can't wait to see what you'll do with it. Happy teaching!